Pac-12 Conference Releases 2019-20 Financial Results
May 20, 2021, 1:22 PM
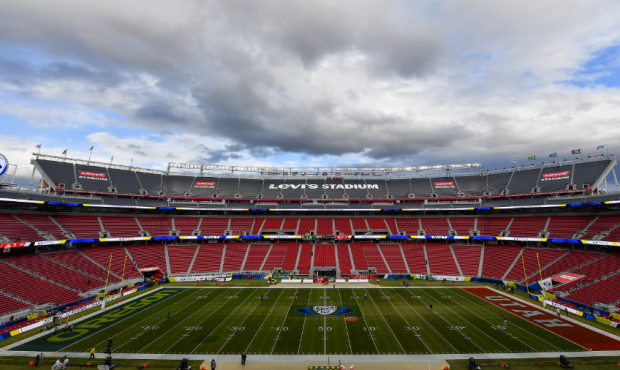
A general interior view of Levi's Stadium during the Pac-12 Championship football game between the Oregon Ducks and the Utah Utes at Levi's Stadium on December 6, 2019 in Santa Clara, California. The Oregon Ducks won 37-15. (Alika Jenner/Getty Images)
(Alika Jenner/Getty Images)

SALT LAKE CITY, Utah – The Pac-12 Conference released on Thursday afternoon their financial results from the 2019-20 fiscal year.
RELATED STORIES


According to a release sent out by the Pac-12 Conference, which was highlighted by $534 million of total revenues, distributions of $403 million, which will average out to $33.6 million per member university.
The year-on-year increase is one percent for total revenues and four percent for distributions. It is a primary result of increases in media rights and postseason bowl revenues. The Pac-12 Networks full ownership by the conference was not included in the reported results.
“The Pac-12 mission is to support our over 7,000 student-athletes both on the field and in the classroom,” said Pac-12 Commissioner Larry Scott. “Our continued financial growth in revenues and member distributions, along with expense management efforts, have and will continue to allow us to support this essential academic and athletic mission.”
The Pac-12 provided a full chart of the reported financial results.
Pac-12 Conference 990 Reporting by Entity (Audited Financial Statements)
| Networks | Conference | Consol | |
| Revenue | |||
| All other contributions, gifts grants, etc | 3,154,942 | 388,367 | 3,543,309 |
| Non-cash Contributions | – | – | – |
| Television Rights Fees | 96,328,632 | 265,538,748 | 361,867,380 |
| Post Season Bowls | – | 119,363,375 | 119,363,375 |
| NCAA Funds/Conf Event | – | 22,946,835 | 22,946,835 |
| Advertising | 14,265,563 | – | 14,265,563 |
| Other Revenue | 4,488,391 | 6,999,347 | 11,487,738 |
| Investment Income | – | 313,688 | 313,688 |
| Total Revenue | 118,237,528 | 415,550,360 | 533,787,888 |
| Expenses | |||
| Compensation of current officers, directors, trustees and key employees (including nontaxable benefits) | 1,250,188 | 5,780,906 | 7,031,094 |
| Compensation not included above to disqualified persons | – | – | – |
| Other salaries and wages | 21,680,802 | 4,452,423 | 26,133,225 |
| Pension plan accruals and contributions (employer portion) | 652,603 | 1,163,729 | 1,816,332 |
| Other employee benefits | 2,586,640 | 1,068,296 | 3,654,936 |
| Payroll taxes | 1,508,540 | 427,195 | 1,935,735 |
| Legal fees | 113,383 | 2,144,589 | 2,257,972 |
| Accounting fees | – | 180,192 | 180,192 |
| Other | 6,592,773 | 1,150,777 | 7,743,550 |
| Advertising and promotion | 656,598 | 924,821 | 1,581,419 |
| Office expenses | 294,495 | 107,835 | 402,330 |
| Information technology | 10,016,327 | 92,637 | 10,108,964 |
| Occupancy | 6,962,263 | 1,560,000 | 8,522,263 |
| Travel | 554,982 | 555,386 | 1,110,368 |
| Conferences, conventions and meetings | 82,920 | 463,480 | 546,400 |
| Depreciation, depletion and amortization | 21,241,308 | 478,479 | 21,719,787 |
| Insurance | 821,353 | 340,080 | 1,161,433 |
| Other Expenses | |||
| Conference Events | – | 9,048,842 | 9,048,842 |
| Special Projects | – | 8,755,301 | 8,755,301 |
| Research and Education | – | 4,387,487 | 4,387,487 |
| Programming & Digital | 2,380,347 | – | 2,380,347 |
| All other Expenses | 4,904,832 | 4,029,608 | 8,934,440 |
| Total Other Expenses | 7,285,179 | 26,221,238 | 33,506,417 |
| Total Expenses | 82,300,354 | 47,112,063 | 129,412,417 |
| Grants to domestic organizations | 35,539,000 | 367,435,418 | 402,974,418 |
| Net Operating Expenses | 117,839,354 | 414,547,481 | 532,386,835 |
| Net Revenues over Expenses | 398,174 | 1,002,879 | 1,401,053 |
Trevor Allen is a Utah Utes Insider for KSLSports.com and host of the Crimson Corner podcast. Follow him on Twitter: @TrevorASports. You can download and listen to the podcast, here.